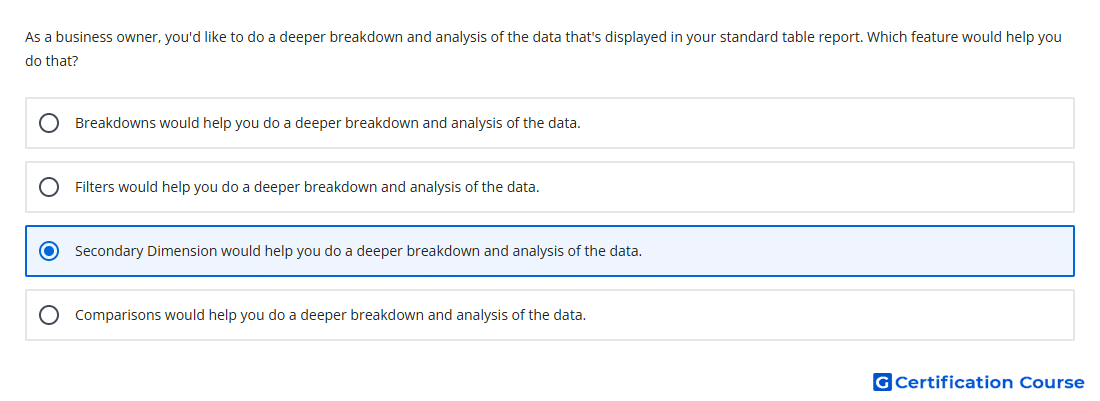
Question: As a business owner, you'd like to do a deeper breakdown and analysis of the data that's displayed in your standard table report. Which feature would help you do that?
- Secondary Dimension would help you do a deeper breakdown and analysis of the data.
- Filters would help you do a deeper breakdown and analysis of the data.
- Comparisons would help you do a deeper breakdown and analysis of the data.
- Breakdowns would help you do a deeper breakdown and analysis of the data.
Explanation
A Secondary dimension adds another dimension to a standard table report for deeper breakdowns. It lets the same metric data be analyzed through an additional attribute alongside the primary dimension. This is useful when a table needs more context without creating a separate exploration or custom report. In Google Analytics, dimensions describe attributes of data, while metrics provide the numerical measurements.
Why the other options are incorrect
Comparisons compare subsets of data across reports, not add a second table dimension.
Filters limit which data appears, but they do not add another breakdown layer to the table.
Breakdowns are used in explorations, not as the standard table report feature described here.
Source for verification
https://support.google.com/analytics/answer/10659476
https://support.google.com/analytics/answer/9143382
The answer(s) to the question is highlighted in the BOLD text above. You can also find more questions and answers related to the exams on the "Google Analytics Certification" page.