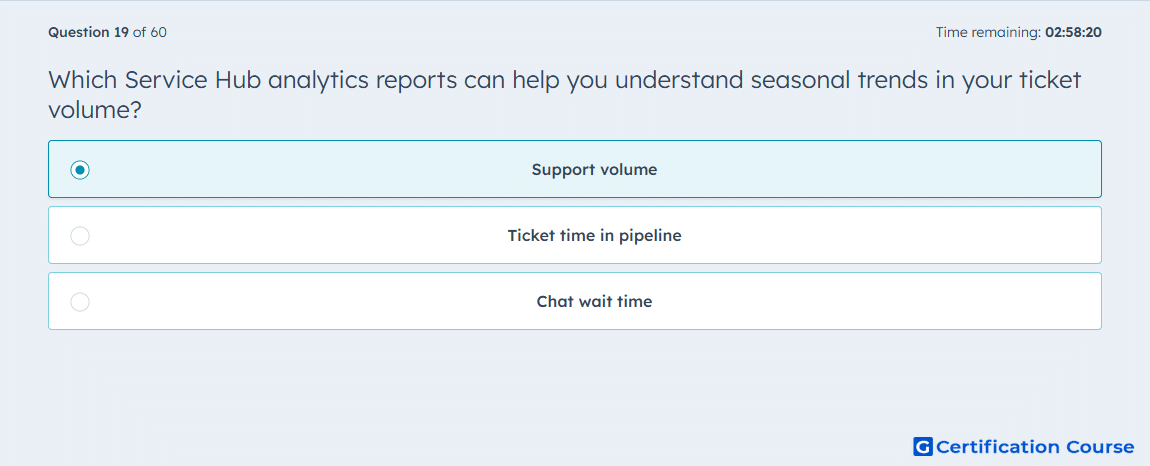
Question: Which Service Hub analytics reports can help you understand seasonal trends in your ticket volume?
- Support volume
- Ticket time in pipeline
- Chat wait time
- Ticket time in pipeline
Explanation
The support volume report tracks the number of tickets created over time, making it ideal for identifying seasonal trends in ticket inflow. It allows analysis of fluctuations by day, week, or month, helping forecast staffing and resource needs. HubSpot uses this report to visualize historical ticket trends and predict periods of high support demand. Monitoring support volume ensures teams can adjust workflows proactively.
Why the other options are incorrect
Ticket time in pipeline measures how long tickets spend in each stage, not seasonal trends.
Chat wait time tracks response times for live chat, unrelated to ticket volume.
Ticket time in pipeline (duplicate) also does not reflect trends in ticket creation.
Source for verification
HubSpot Service Analytics
The answer(s) to the question is highlighted in the BOLD text above. You can also find more questions and answers related to the exams on the "HubSpot Reporting" page.