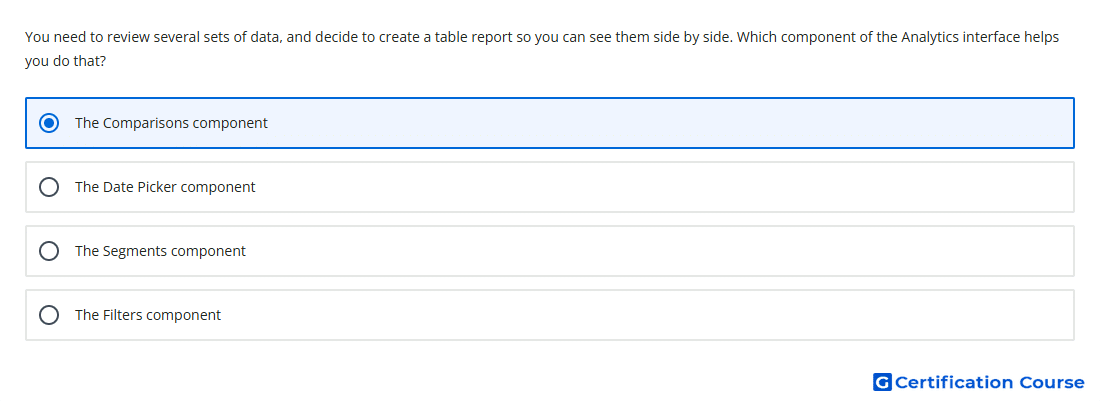
Question: You need to review several sets of data, and decide to create a table report so you can see them side by side. Which component of the Analytics interface helps you do that?
- The Comparisons component
- The Filters component
- The Date Picker component
- The Segments component
Explanation
Comparisons let you evaluate subsets of data side by side in Google Analytics reports. They can be applied to standard reports to compare groups based on dimensions such as device, country, or traffic source. This helps review multiple data sets within the same report view without building a separate exploration. The comparison remains tied to report analysis rather than data collection or configuration.
Why the other options are incorrect
Segments are used in explorations, not as the standard report component for side-by-side report comparison.
Date Picker changes the reporting time range, not the data groups being compared.
Filters limit report data, but they do not create side-by-side comparisons.
Source for verification
https://support.google.com/analytics/answer/10096620
The answer(s) to the question is highlighted in the BOLD text above. You can also find more questions and answers related to the exams on the "Google Analytics Certification" page.