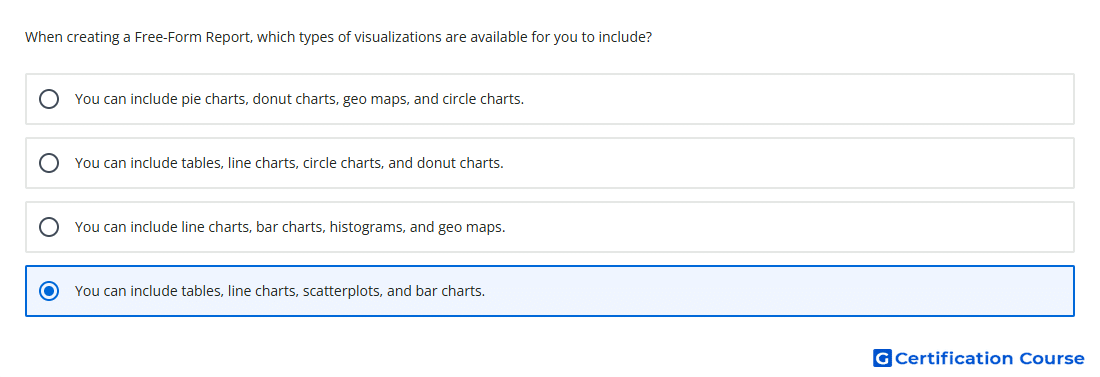
Question: When creating a Free-Form Report, which types of visualizations are available for you to include?
- You can include tables, line charts, scatterplots, and bar charts.
- You can include tables, line charts, circle charts, and donut charts.
- You can include line charts, bar charts, histograms, and geo maps.
- You can include pie charts, donut charts, geo maps, and circle charts.
Explanation
A Free-form exploration uses the visualization selector in Explore to display data in supported table and chart formats. Table, Line chart, Scatterplot, and Bar chart are valid visualization types for this technique. These formats support flexible analysis by combining selected dimensions, metrics, segments, and filters. Visualization settings are configured within the exploration tab rather than through standard reports.
Why the other options are incorrect
A includes histograms, which are not listed as a Free-form exploration visualization type.
B includes circle charts, which are not listed as a Free-form exploration visualization type.
D includes circle charts and does not include the complete set of supported visualization types in the correct grouping.
Source for verification
https://support.google.com/analytics/answer/9327972
The answer(s) to the question is highlighted in the BOLD text above. You can also find more questions and answers related to the exams on the "Google Analytics Certification" page.