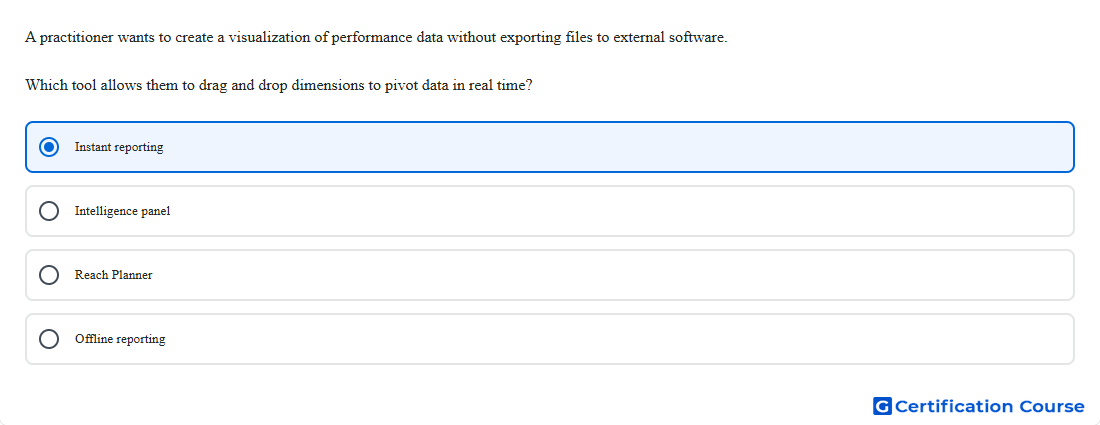
Question: A practitioner wants to create a visualization of performance data without exporting files to external software. Which tool allows them to drag and drop dimensions to pivot data in real time?
- Offline reporting
- Intelligence panel
- Instant reporting
- Reach Planner
Explanation
Instant reporting is the in-platform reporting workspace for building and visualizing performance data inside Display & Video 360. In the report builder, users drag dimensions into the Row area and metrics into the Column area, then update the report directly in the interface. It also supports Pivot data by adding a pivot metric in the Column area, which allows segmented analysis without moving the data into external software. That matches a real-time, drag-and-drop workflow rather than a forecasting, alerting, or download-first tool. Google Help+1
Why the other options are incorrect
Intelligence panel surfaces alerts and suggestions for optimization and troubleshooting, not interactive report construction or pivot-based data exploration. Google Help
Reach Planner is a planning tool for forecasting reach, frequency, and media-plan outcomes, not a live reporting interface for pivoting performance data. Google Help
Offline reporting is used for report types that are created for download, not for real-time drag-and-drop visualization inside the reporting workspace. Google Help+1
Source for verification
Instant reporting — Display & Video 360 Help Google Help
Reports that require download — Display & Video 360 Help Google Help
The answer(s) to the question is highlighted in the BOLD text above. You can also find more questions and answers related to the exams on the "Search Ads 360" page.