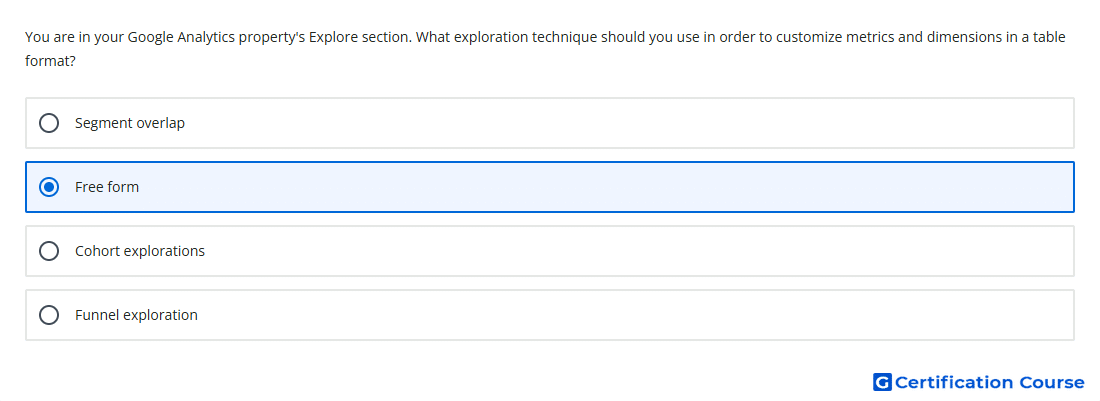
Question: You are in your Google Analytics property's Explore section. What exploration technique should you use in order to customize metrics and dimensions in a table format?
- Funnel exploration
- Free form
- Segment overlap
- Cohort explorations
Explanation
Free-form exploration lets you build a customizable table using selected dimensions and metrics. It supports flexible rows, columns, values, segments, and filters in the Explore section. This technique is appropriate when the analysis needs a table format rather than a predefined report layout. It can also switch between supported visualizations while keeping the same underlying exploration setup.
Why the other options are incorrect
Cohort explorations analyze groups of users with a shared characteristic over time.
Funnel exploration analyzes the steps users take toward completing a defined sequence.
Segment overlap compares how different user segments intersect with one another.
Source for verification
https://support.google.com/analytics/answer/9327972
The answer(s) to the question is highlighted in the BOLD text above. You can also find more questions and answers related to the exams on the "Google Analytics Certification" page.